Chapters
Mathematics For Machine Learning
Probability Fundamentals
Chapters
Introduction
Statistics provides methods for organizing and summarizing data, for drawing conclusions
based on information conatined in Data.
Statistics works on Data to make summaries and inferences. Data results from making observation
on either a single variable, i.e. Univariate Data,
or observations on multiple variables, i.e. Multivariate Data.
Statistics is often used as an investigator's tool. The investigator may simply wish to describe
and summarize important aspects of the collected
data, i.e. Descriptive Statistics. This could be either graphical in nature, or numerical
in nature.
In absence of Population, i.e. collection of data points of interest, the investigator
may have to work on Sample data, i.e. a subset or a portion of Population. In such
situations, the investigator will have to use sample information to draw conclusions/inferences
about the Population data set. This form of generalizing Population from Sample is called as
Inferential Statistics.
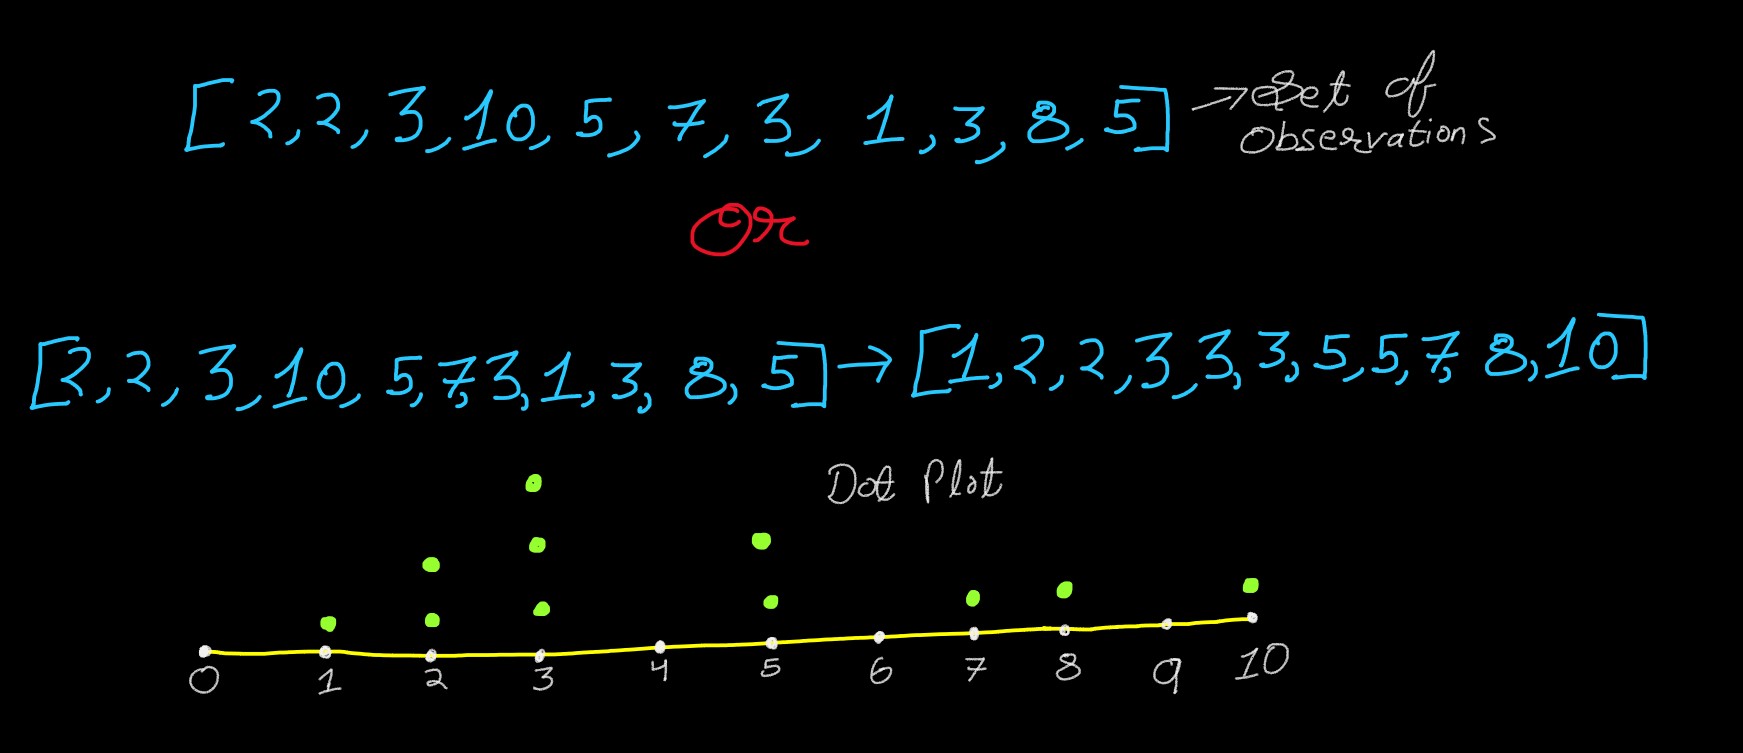
Collection of data can be represented in numerical form, i.e. a set of observation. Or in a
graphical form, i.e. Dot-Chart
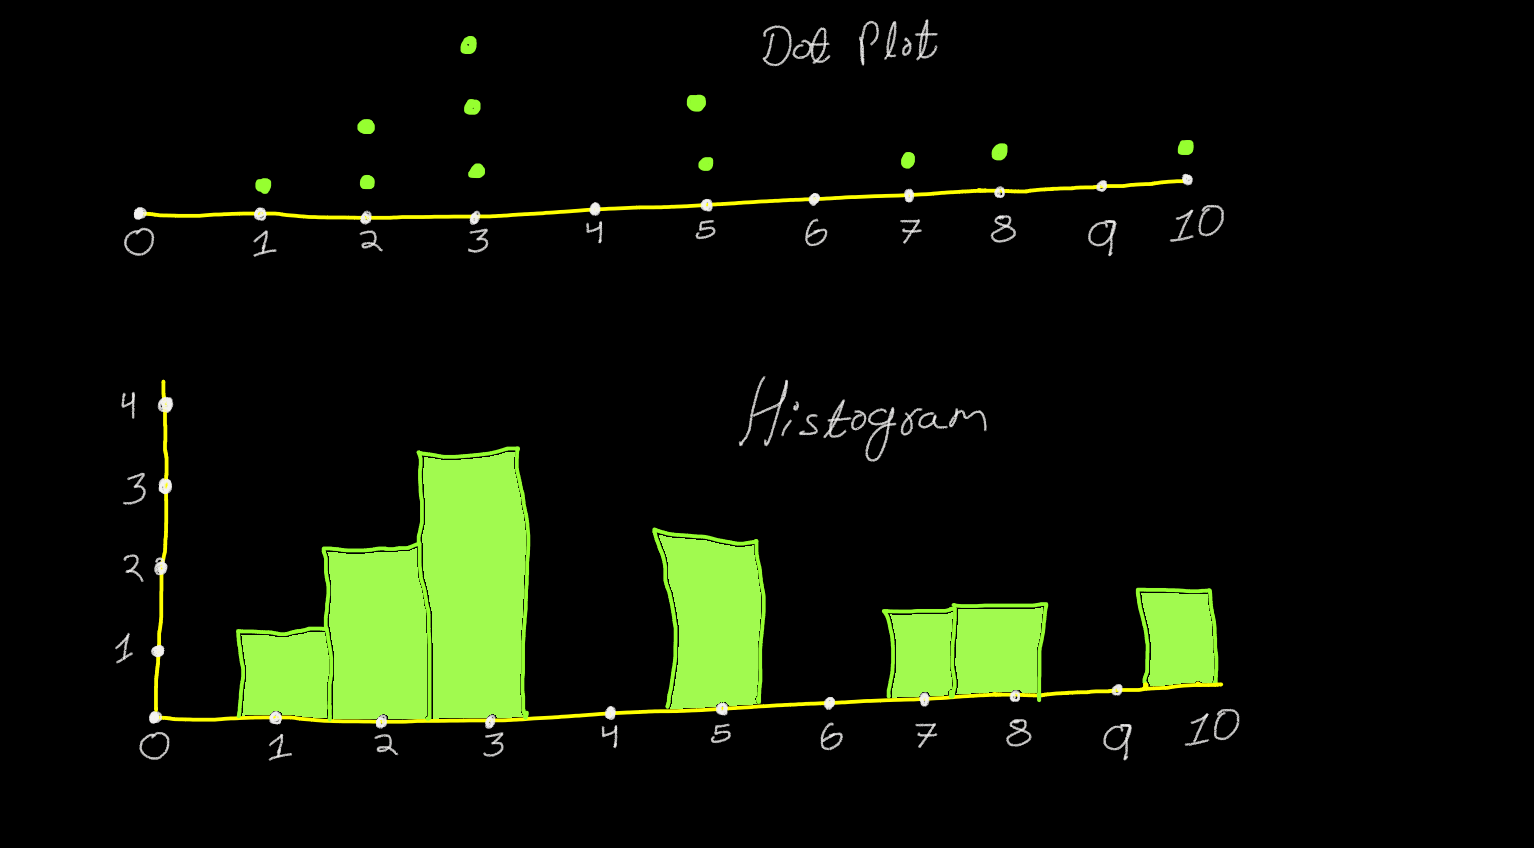
Frequency can also be graphically presented in the form of Histogram
Or, a smoothed histogram called as Density Estimate
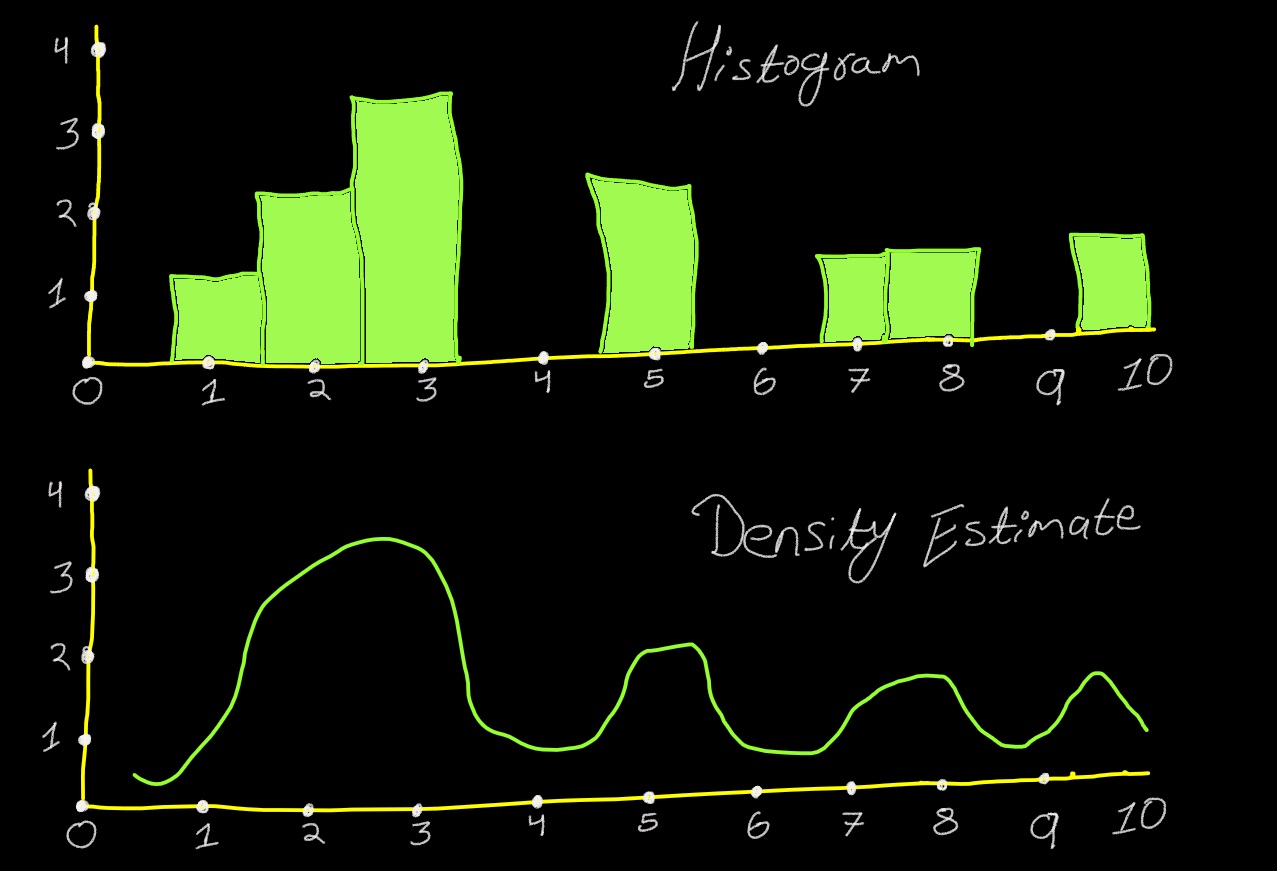
A histogram, or density estimate could either be Symmetric (left half being mirror of right
half), or it could be Skewed.

Sample Space & Events
Probability is the study of randomness and uncertainity. Probability theory is the foundation on which descriptive and predictive analytics is performed.
And any activity or process whose outcome is subject to uncertainity or randomness is called as Experiment. E.g. tossing of a coin, selecting a card from a deck, weiging of a loaf of bread, measuring strength of metal beams, etc.
And the set of all possible outcomes from an experiment is called as Sample Space often
denoted by S, Ω(Omega), or U (for "universal set"). E.g. if you toss a fair coin, the Sample
Space S = (Heads, Tails)
And if you toss 2 coins, S = (Heads-Heads, Heads-Tails, Tails-Heads, Tails-Tails)
Now we saw that, S = (Heads-Heads, Heads-Tails, Tails-Heads, Tails-Tails) is Sample Space
of 2 coins being tossed. However, if we want to take only those results into consideration,
where there must exists atleast 1 Tail, then our set would look something like:
S = (Heads-Tails, Tails-Heads, Tails-Tails)
This is an Event, i.e. a subset of a Sample-Space S, i.e. E1=Heads-Tails, E2=Tails-Heads
& E3=Tails-Tails.
We have been calling event as set in above example of atleast 1 Tail. Which means if Event is considered as a Set, then it must satisfy the Set-Theory which states:
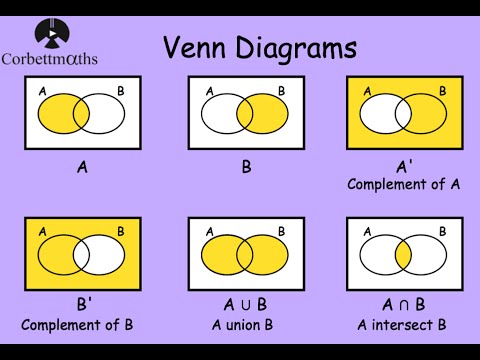 Credits: schematron.org
- Complement: If an Experiment has a Sample Space, which has an Event E1, then the E1 complement (E1') must be all the ouctomes present in Sample Space, except E1
- Intersection: Intersection of 2 events A & B is denoted by A ⋂ B, and read as A and B, is an Event consisting of all the events that are in both A and B
- Union: Union of 2 events A & B is denoted by A U B, and read as A or B, is an Event consisting of all the outcome of either Event A, or in Event B, or in both events
E.g. If A = {0,1,2,3,4}, B = {3,4,5,6} & C = {1,3,5}, then
- A ⋂ B = {3,4}
- A U B = {0,1,2,3,4,5,6}
- A'= S-A = {5,6}
- A U C = {0,1,2,3,4,5}
There can also exists a scenario where the Event can have no outcome, e.g. if A = {0,1,2,3,4}, B = {5,6} then A ⋂ B = ϕ, i.e. null event, or disjoint event, or mutually exclusive events
