Chapters
Tree Based Algorithms
Decision Trees
Chapters
Table of Contents
Building Decision Tree Regressor
Roughly Speaking, thier are 2 steps involved:
- We divide the predictor space — that is, the set of possible values for X1,X2, . . . ,Xp — into J distinct and non-overlapping regions, R1,R2, . . . ,RJ .
- For every observation that falls into the region Rj , we make the same prediction, which is simply the mean of the response values for the training observations in Rj
The goal is to find boxes R1, . . . ,RJ that minimize the RSS, i.e. Residual Square of Sum
How many partitions in partitions R1....Rj? We can make use of Recursive Binary Splitting
Recursive Binary Splitting says, we first select the predictor Xj and the cutpoint s such that
splitting the predictor space into
the regions {X|Xj < s} and {X|Xj ≥ s} leads to the greatest possible reduction in RSS.
That is, we consider all predictors X1, . . . ,Xp, and all possible values of the cutpoint s
for each of
the predictors, and then choose the predictor and cutpoint such that the resulting tree has
the lowest RSS.
And this step is repitively done, one 1 region less every time, until a stopping criterion
is reached
Tree Pruning
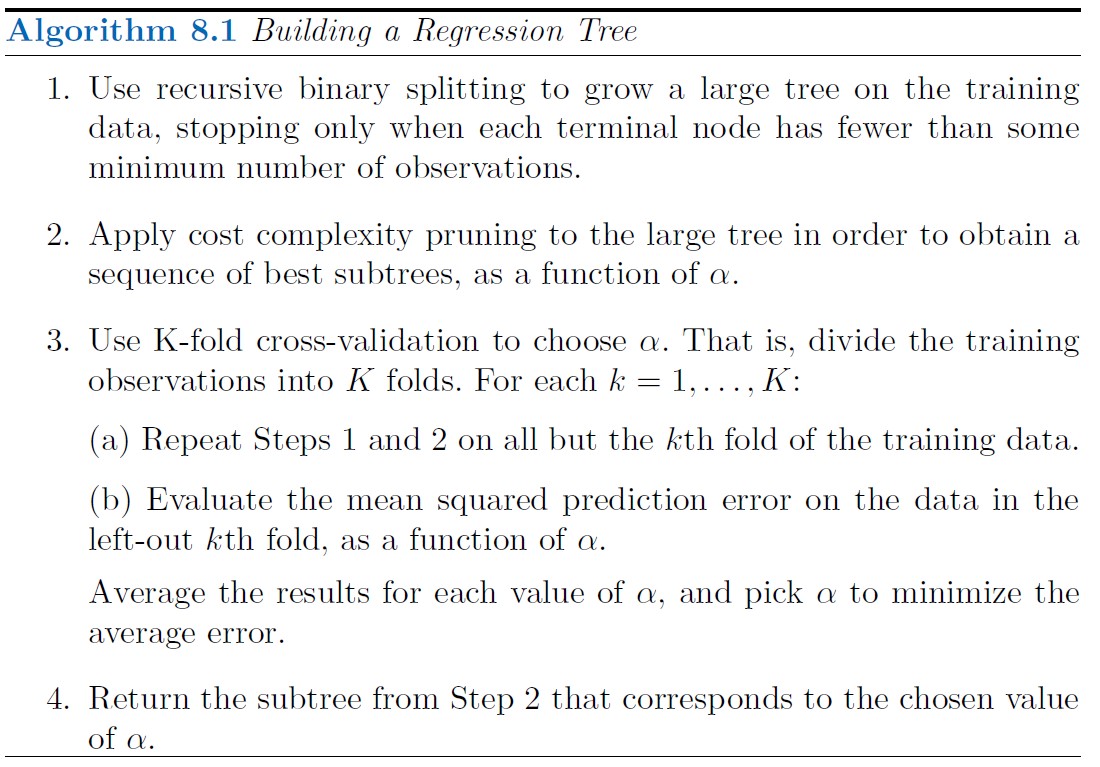
The strategy is to grow a very large tree T0, and then prune it back in order to obtain a subtree. How do we determine the best prune way to prune the tree? Intuitively, our goal is to select a subtree that leads to the lowest test error rate.
Cost complexity pruning ( also known as weakest link pruning ), gives us
a way to do just this. Rather than considering every possible subtree, we
consider a sequence of trees indexed by a non-negative tuning parameter α.
For each value of α there corresponds a subtree T ⊂ T0 such that

Here |T| indicates the number of terminal nodes of the tree T, Rm is the rectangle (i.e. the subset of predictor space) corresponding to the mth terminal node, and ˆyRm is the predicted response associated with Rm—that is, the mean of the training observations in Rm. The tuning parameter α controls a trade-off between the subtree’s complexity and its fit to the training data.

Building Decision Tree Classifier
For a classification tree, we predict that
each observation belongs to the most commonly occurring class of training
observations in the region to which it belongs.
In interpreting the results of a classification tree, we are often interested not only in the
class prediction
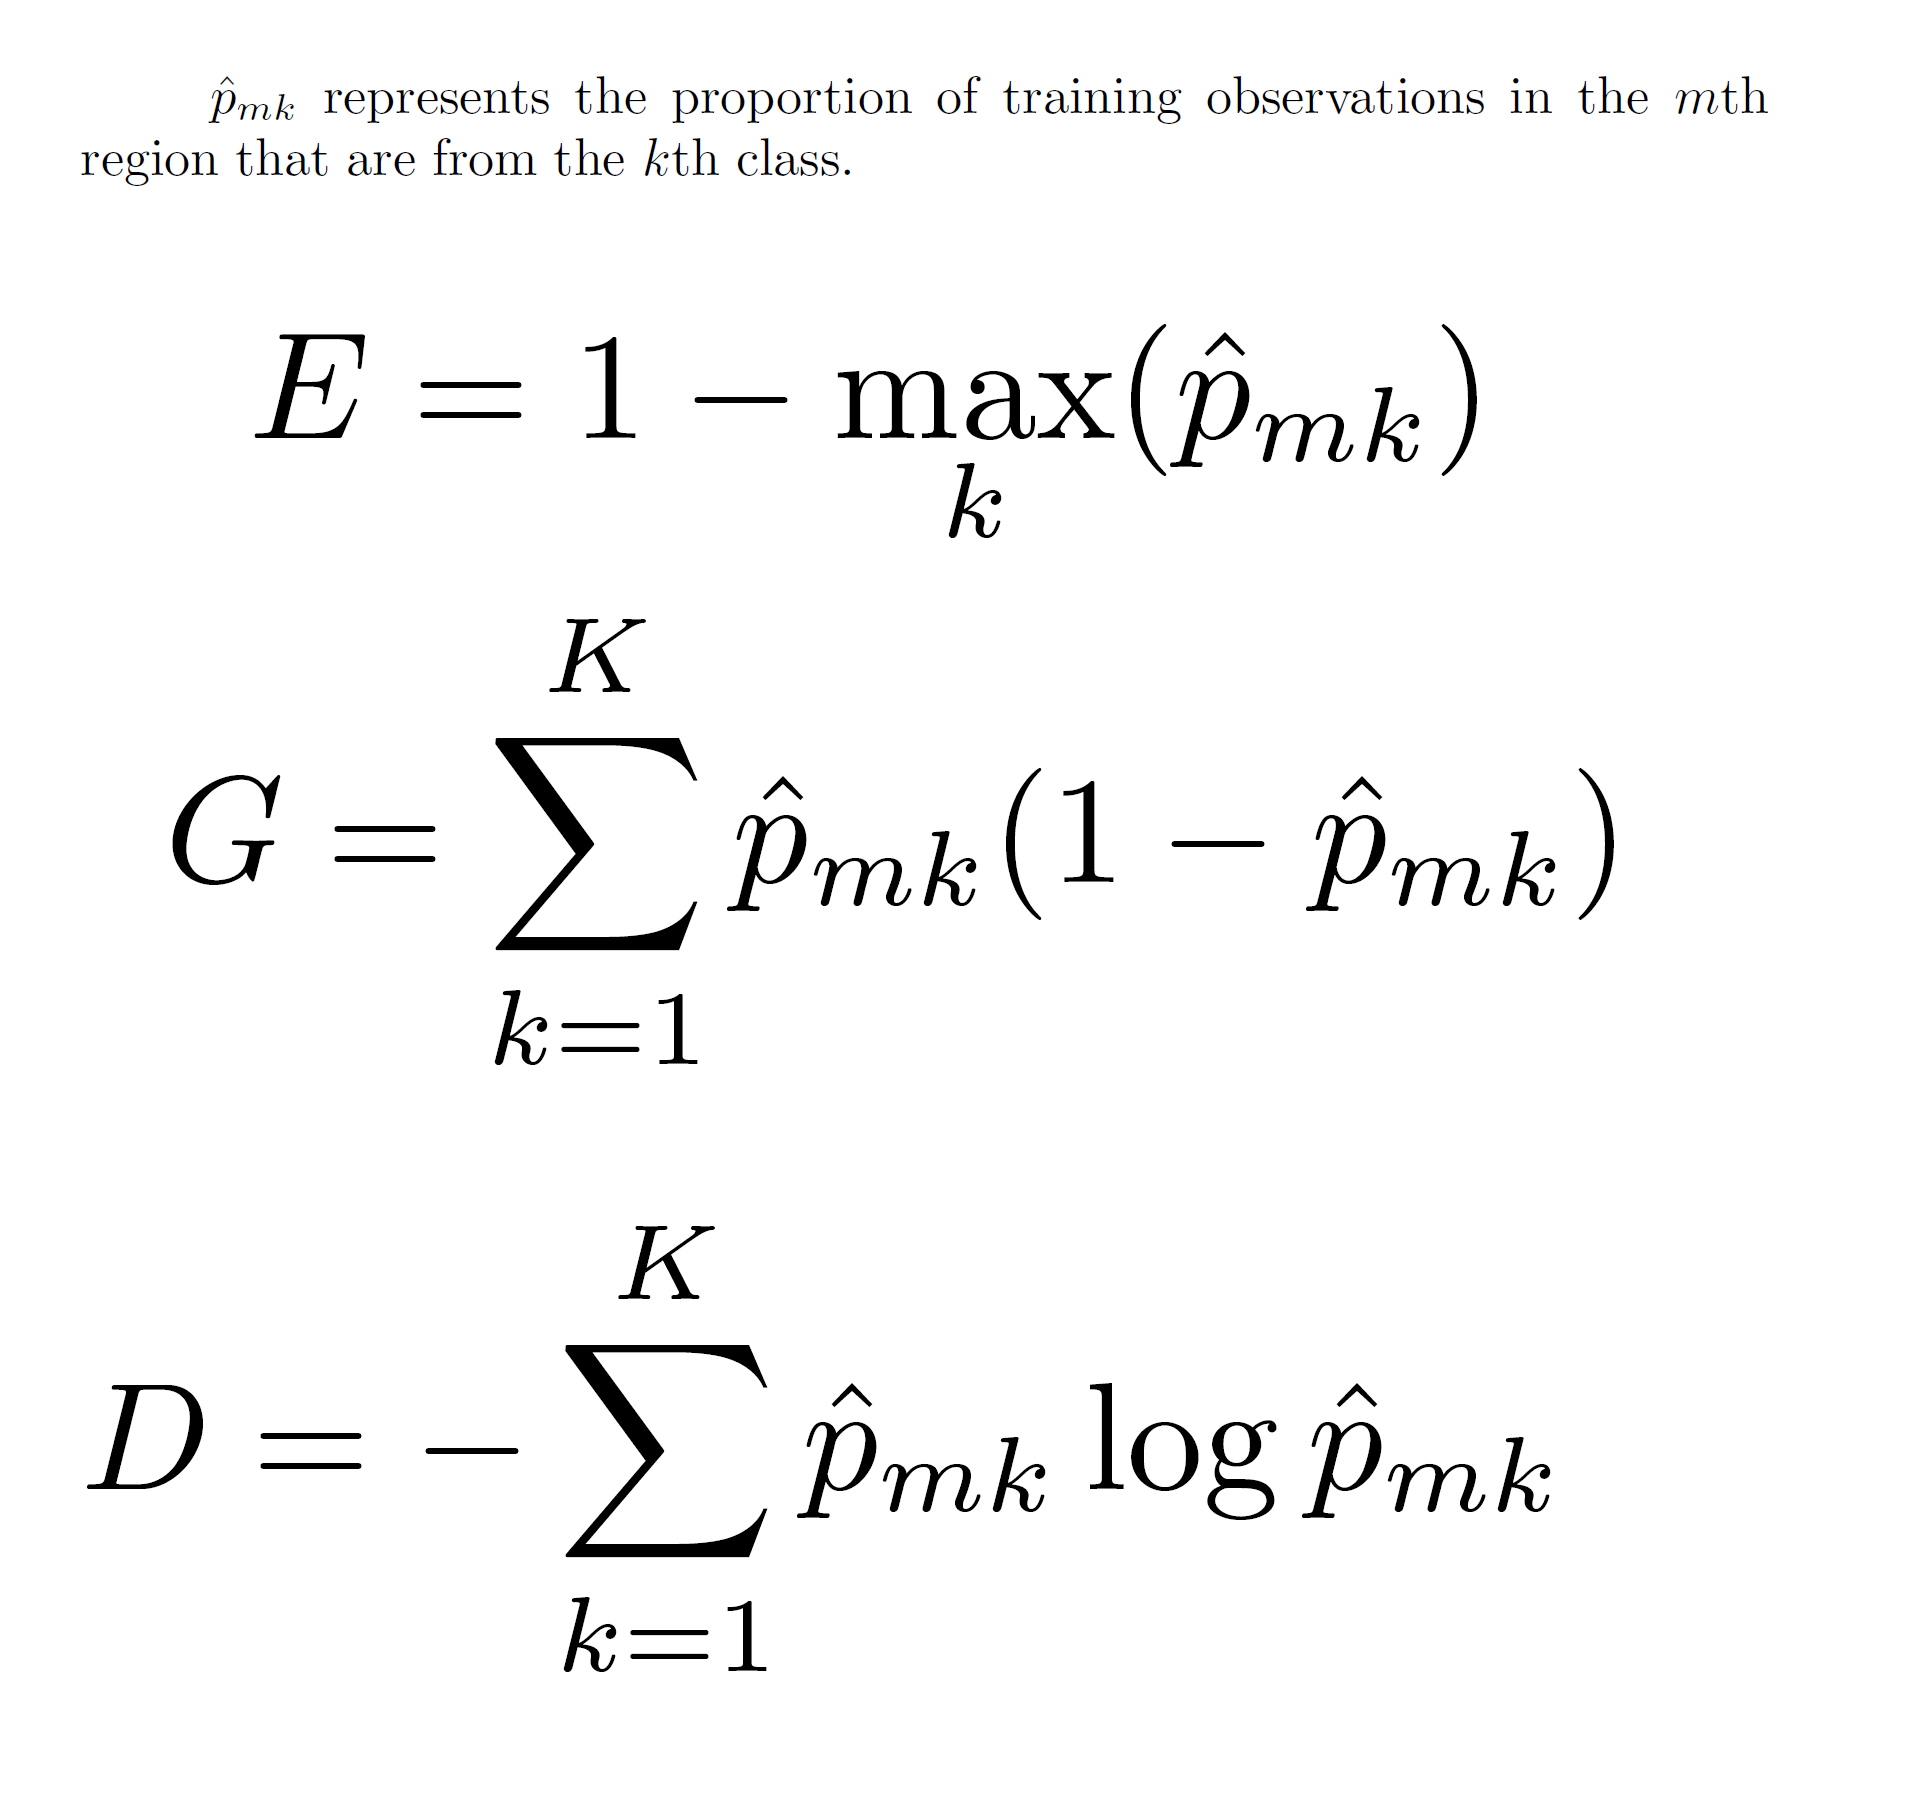
corresponding to a particular terminal node region, but also in the class proportions among the
training observations that fall into that region.

Gini index is referred to as a measure of node purity—a small value indicates that a node contains predominantly observations from a single class. An alternative to the Gini index is Entropy
